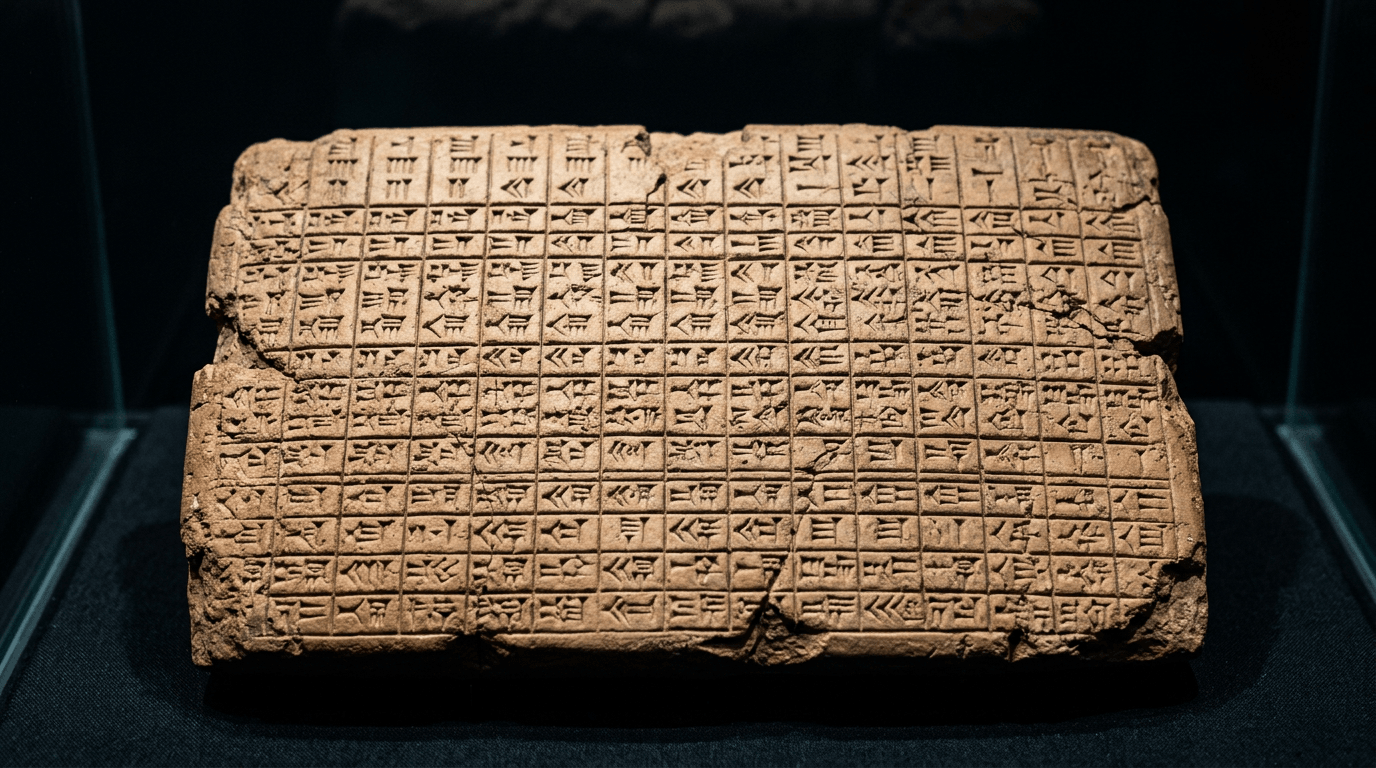
The grid is one of the oldest cognitive tools in human history. Sumerian accountants pressed rows and columns into wet clay 4,000 years ago. Renaissance architects drew on graph paper to design buildings that still stand. Rows and columns aren't a software convention. They're a cognitive instinct.
An Interface Built for Decision Making
For infrastructure project developers, the grid isn't just familiar — it's essential.
Time is the backbone of every infrastructure project. Decision impacts compound, capital flows in, costs accumulate, revenues arrive — all across a timeline that spans development, construction, commissioning, and operations. While a chart gives you a summary, the grid shows you how a single assumption — a capacity factor, an offtake price, or a debt sizing convention — evolves across periods, changes shape, and interacts with everything around it.
Beyond time, the grid is a universal language. Hand a model to a lender, an equity partner, an engineer, or a regulator and they'll already know how to read it. No translation required.
The Engine Hasn't Kept Pace
The grid view continues to be a critical way to understand a project. But the engine powering the grid view hasn't evolved to match the complexity of the work it has to model.
Modern project development isn't like yesterday's. Modern offtake structures are novel, attempting to capture myriad new risks posed by emerging technologies and FOAK projects. The financial instrumentation is bespoke with a wider mix of investors in the capital stack. Policy shifts, commodity prices, and supply chains move in ways that conventional modelling engines were never expected to handle.
The conventional modelling engine was built for a different world. No automatic versioning. No automated integrity checks. No integrated AI. No awareness of the specific workflows this work requires.
FOAK projects must navigate a far more complex environment. When a lender asks what a gas price spike does to your levelized cost, you need to show them, not promise them. In modern infrastructure finance, that gap isn't an inconvenience. It's a deal killer.
Bringing the Grid to All Blocks
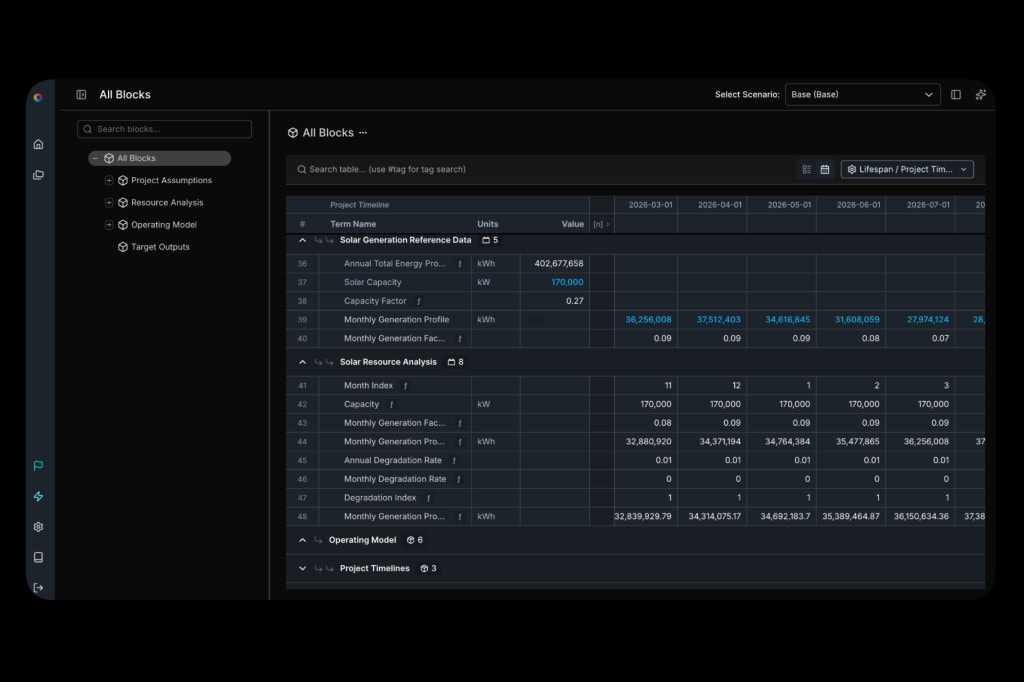
On the Aire Platform, you can now toggle grid mode directly from the All Blocks page, allowing you to more easily see time series data within your project model. With our header configuration, you can control whether you are looking at your data through the lens of weeks, months or years of a project. You can see how assumptions shift across time, how one value relates to another, or how a change in one part of the model moves through everything connected to it. This makes it easy to watch your project evolve, tracking cashflows from construction through operation.
Underneath it, Aire's powerful project modelling engine continues to do the heavy lifting. Scenarios run live and independently — switch between them directly from the grid to see how your model behaves under different conditions. Project AI sits alongside the grid; you can ask what's driving a result, ask it to add terms, blocks, or formulas on your behalf — without leaving the view. The structured database handles the logic invisibly, so you can focus on reading the numbers.
Get Started
Already using Aire? Open your project and toggle Grid Mode from the All Blocks view.
New to Aire? Contact our team to get started and try Grid Mode.
Want to see it live? Book a Demo.